Climate Displacement

Predicting Climate Migration and Refugees
Introduction
Climate disasters, induced by the changing climate, are becoming increasingly prevalent. These disasters are not only causing irreparable harm to the environment, but are also creating a surge of migrants and refugees. Over 7 million people living across 104 countries and territories were displaced by climate disasters in the year 2020 alone, Migration Data Portal. Furthermore, natural disasters now amount for approximately 75% or 30.7 million of internal displacements within countries across the world, Migration Data Portal.
This research seeks to create a neural network model to predict the number of people - both climate migrants and refugees - displaced by climate disasters in the United States.
It is extremely challenging to accurately predict the number of displaced people for a variety of reasons. First, there is no concrete combination or set of variables that inevitably leads to climate displacement. For example, a combination of extreme temperatures and drought - with no particular temperature or water threshold - may drive a person away from their home. Thus, it is very hard to predict at what threshold, with infinitely many climate variables, a person may choose or be forced to leave their home. Finally, there is no centralized database that can be utilized to find the number of climate refugees each year in the United States.
This research seeks to overcome these challenges by creating a custom dataset while utilizing a neural network to detect and predict patterns often unobservable with traditional statistical analyses.
The custom dataset is comprised of US state-to-state migration data and all climate disasters classified as emergencies by the Federal Emergency Management Agency (FEMA). Utilizing the custom dataset containing the number of specific disaster types per year, this information was used to predict climate migration. The neural network then output a prediction of the number of migrants. Though the predictions from the neural network were not extremely accurate, this research did find that certain measures of climate disasters can likely predict drivers behind general migration patterns in the US.
An ethical assessment was also conducted to explore the potential implications of utilizing such a model. It explored the weaknesses in the dataset which may product bias in the neural network model - specifically within the context of climate justice.
Literature Review
In order to design a comprehensive neural network that encompasses and addresses the factors primarily causing climate migration, it is important to first examine the political and environmental climate that leads to such displacement. In a recent study, Governing climate displacement: the ethics and politics of human resettlement, researchers found that climate change is projected to raise difficult ethical issues. Specifically, these issues center around what governments and international organizations should do to protect human populations displaced by climate disasters and long term environment change. Research found that when migration is planned and supported through public policy, it can stabilize and diversify livelihoods as well as reduce potential vulnerabilities to environment shocks. Without supportive public policies, there can be sever consequences. Currently, governments discourage migration though the utilization of labor codes, land restrictions and other policy instruments. Thus, this research seeks encourage governments to allow for the movement of people to help mitigate the potentially devastating effects of climate change.
Based on the article Climate Change, Migration, and Governance authored by Susan Martin, there is a growing recognition about the influences that the effects of climate change will have on migration internationally. These climate change-induced migrations will likely pose strains to existing systems and structures of society. Yet, our legal and institutional frameworks remain poorly developed to handle these growing issues. Because of the current poorly developed frameworks in place to handle these problems, new approaches must be made in order to make strides towards future solutions. To start, research and analysis of existing climate data to identify hardest affected areas, trends of migration, and more is essential before moving forward.
Research examining migration patterns, caused by climate change, have primarily been examined and modeled with direct correlations to sea level rise. A key study, Modeling migration patterns in the USA under sea level rise, modeled the future patterns of climate migration based on current NOAA digital coast datasets, small area population projects and a Machine Learning method for modeling human migration. After modeling the initial impacts of sea level rise, researchers used a artificial neural network (ANN) method previously fit with county migration data from the United States in order to ultimate determine climate migration predictions. The methodology and design of the models enabled researchers to produce new results that were able to differentiate between the impacts of migration, both directly and indirectly caused by sea level rise, from historical trends in migration.
Another study that attempts to model climate displacement in a different manner is Drought Displacement in Kenya, Ethiopia and Somalia. Researchers developed a Pastoralist Livelihood and Displacement Simulator which produced seemingly accurate estimates of displacement caused by drought throughout the horn of Africa. Unlike previous models, this simulator included climate, environment and social science data into a system dynamics model - a model commonly used to examine population movements and behavior of systems. However, due to data discrepancies in specific parts of the horn of Africa as well as social impacts such as changes in family structures and education, researchers recommend that the model be improved.
This research, both the social science behind climate migration and past climate migration predictive models outside of the United States, will inform this current study.
Methods
All code for this research was hosted on a GitHub repository. This repository contains a brief research paper, raw and cleaned data as well as a Jupyter Notebook. The Jupyter Notebook - notebook.ipynb - contains code that cleaned the data, analyzed the data as well as created the neural network itself.
The Jupyter Notebook - the heart of this research - contains code all written in the Python programming languages. Several libraries including shutil, pandas, os, glob, csv, numpy, fastai and seaborn were utilized.
Preprocessing of the data was the first step taken in this research. A FEMA dataset, Federal Emergencies and Disasters, 1953-Present, Federal Emergency Management Agency, was imported in order to provide information about the types of natural disasters that occur each year in this United States. This dataset includes records of major natural diasters - hurricanes, tornados, storms, high waters, wind-driven waters, tidal waves, tsunamis, earthquakes, volcanic eruptions, landslides, mudslides, snowstorms, or droughts, fires, floods, or explosions. A new csv file was created from the raw data called “State_Disasters_by_Year.csv.” It contained the start year, end year, state and disaster types. The first five rows are pictured below:
| _ | State | Disaster Type | Start Year | End Year |
|---|---|---|---|---|
| 0 | TX | Winter | 1989 | 1989.0 |
| 1 | TX | Winter | 1989 | 1989.0 |
| 2 | TX | Winter | 1989 | 1989.0 |
| 3 | TX | Winter | 1989 | 1989.0 |
| 4 | TX | Winter | 1989 | 1989.0 |
The second dataset, IRS Migration Data, State-to-State US Migration Data (1990-2011) SOI Tax Stats - Migration Data, Internal Revenue Service, contains records of the number of US Citizens moving between states which includes the attributes such as year, state and number of migrants - further broken down into individual and family as well as inflow and outflow. A new csv file called “State_Migration_by_Year.csv” was created containing the state, year, number of household inflow movements - NOR(I), number of individual inflow movements - NOR(I), number of household outflow movements - NOE(O), and number of individual outflow movements - NOE(O). The first five rows are pictured below:
| _ | State | Year | NOR(I) | NOE(I) | NOR(O) | NOE(O) |
|---|---|---|---|---|---|---|
| 0 | MN | 2010 | 41038.0 | 73463.0 | 45173.0 | 77893.0 |
| 1 | AZ | 2010 | 83528.0 | 158038.0 | 80278.0 | 162164.0 |
| 2 | AL | 2010 | 42880.0 | 89794.0 | 43563.0 | 88001.0 |
| 3 | MO | 2010 | 55637.0 | 106395.0 | 60740.0 | 115708.0 |
| 4 | NC | 2010 | 114845.0 | 226709.0 | 101963.0 | 201396.0 |
These two cleaned datasets were then merged into one file called “Neural_Network_Input.csv”. This file contained state, year, NOR(I), NOE(I), NOR(O), NOE(O) as well as a column for each natural disaster with a corresponding value of the amount of times each disaster occured in the given state and year. The first five rows are pictured below of the aggregate of “Neural_Network_Input.csv” by year. This new file was called “Total_Input_Training.csv”:
| _ | State | Year | NOR(I) | NOE(I) | NOR(O) | NOE(O) | Drought | … | Winter | Total disasters |
|---|---|---|---|---|---|---|---|---|---|---|
| 0 | All_States | 1990 | 2907749 | 5847606 | 2890627 | 5778931 | 0 | … | 1 | 31 |
| 1 | All_States | 1991 | 2945112 | 5865274 | 2812812 | 5581421 | 0 | … | 0 | 35 |
| 2 | All_States | 1992 | 2963061 | 5941502 | 2862291 | 5777889 | 0 | … | 0 | 38 |
| 3 | All_States | 1993 | 2917053 | 5828928 | 2846298 | 5712493 | 1 | … | 0 | 47 |
| 4 | All_States | 1994 | 3018906 | 5942498 | 2937673 | 5814595 | 0 | … | 1 | 32 |
Next, data analysis utilizing pandas, numpy and seaborn was conducted. The data was manipulated to visualize the amount of migrations per year, and the amount and type of natural disasters per year. Further analysis was taken to understand the correlations between migration and disaster types in the form of pure statistics as well as heat maps.
Finally, the Fastai library was utilized in order to build a tabular neural network model. This model inputs disaster types and outputs the predicted number of migrants - inflow, outflow, individual and household.
Discussion
Our research sought to understand the various correlations and trends between migration and a variety of natural disasters in the United States.
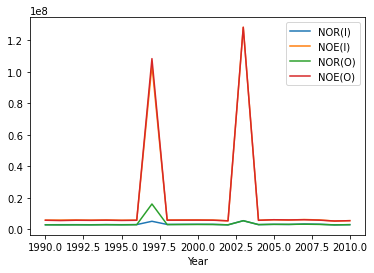
The following graph displays migration trends in the United States between the years of 1990 and 2010. It is evident that despite specific outliers, migration increases slowly, but remained very stable during this period of time.
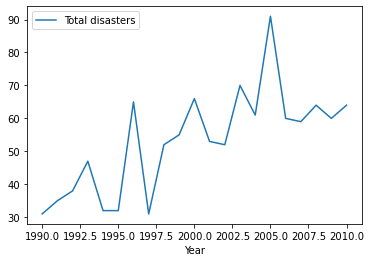
This next finding shows the total amount of natural disasters recorded over the time period of 1990 to 2021. There is a clear increase in the number of natural disaster recorded by FEMA each year.
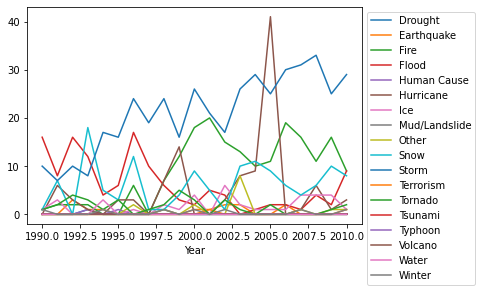
This next graph shows the frequency of difference natural disaster types that occured between the years of 1990 to 2010. It is apparent that drought and fire are the top natural disasters. Dought is currently on an upward trend.
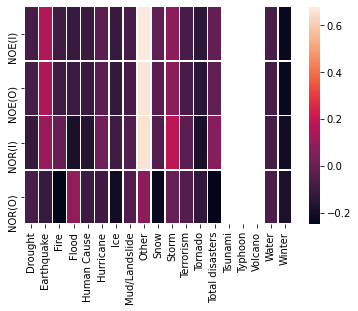
In order to understand how each natural disaster impacted the number of migrants each year, we queried the top correlations between each given type of migration. NOE(I) or the number of household inflow movements correlated the highest with the total number of natural disasters in a given year (correlation = 0.0123). NOE(O) or number of individual outflow movements correlated highest with the total number of natural disaster in a year as well (correlation = 0.0123). However, NOR(I) or number of household inflow movements correlated with the number of fires per year (correlation = 0.0037). Finally, NOE(O) or number of individual outflow movements correlated highest with the number of storm disasters in a year (Correlation: 0.0017).
The following heatmap was created in order to demonstration the correlations - the driving factors - between migrants in the United States. It is important to note that these correlations do not necessarily show necessarily show cause (disaster) and effect (migration). Future work would need to be conducted to confirm that these disasters are motivating factors of climate migration.
The final aspect of this study was placing the data through a neural network. The number of different natural disasters for each year was the input and the different types of migration movements - NOE(I), NOE(O) and NOE(O) - were the outputs. Unfortunately since there were only 20 years of data, there were only 20 rows of data to train our model on. The following is the output of the training to our neural network utilizing Fastai’s Tabular model. The training and validation loss after 100 epochs, each with a batch size of two are displayed. All hyperparameters were automatically set by Fastai.
| _ | epoch | train_loss | valid_loss | mse | mae | time |
|---|---|---|---|---|---|---|
| 0 | 1.739364 | 0.110877 | 0.110877 | 0.293532 | 00:00 | |
| 1 | 1.683594 | 0.181669 | 0.181669 | 0.351264 | 00:00 | |
| 2 | 1.512090 | 0.636447 | 0.636447 | 0.623331 | 00:00 | |
| 3 | 1.569106 | 1.822774 | 1.822774 | 0.992073 | 00:00 | |
| 4 | 1.537006 | 9.387090 | 9.387090 | 2.136368 | 00:00 | |
| … | … | … | … | … | …. |
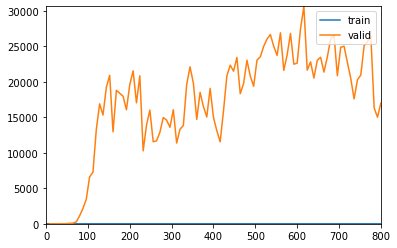
It is evident that as the training loss decreases, the validation loss increases. Though we are unsure as to why we observed this result, it is probable that the dataset was too small to create an accurate model. Another potential explanation is that there was some aspect of the Fastai back-end that interacted with our model in an unexpected way. Thus, the outputs to the neural network were not extremely accurate given this model.
Ethics
In order to fully understand the ethical implications of our research, it is important to analyze both the inputs to the neural network as well as the use cases for the outputs of the neural networks. Despite efforts to find an unbiased datasource, it is clear that the dataset input into the neural network contains bias. First, the dataset, SOI Tax Stats - Migration Data (Internal Revenue Service and Federal Emergencies), only contains data of US citizens. Thus, any other person living in the US without this status including undocumented people, homeless people and others will be left out. This means that migration of potentially vulnerable populations will unfortunately not be included in the final migration estimates. Furthermore, due to environmental racism and failure to document climate disasters in more vulnerable areas, it is also possible that the 1953-Present (Federal Emergency Management Agency) dataset contains bias. Given the bias inputs to the neural network, the results of this research should be used with caution.
Reflection
If conducted again, the most important change to this research would have been more data. Though there is very little data which directly measures climate migrants and refugees in the United States, future studies should seek to create new synthetic datasets. These datasets could serve as more ample data for training and creating a neural network model.
Furthermore, different neural network models as well as decision trees should be utilized to predict the number of climate migrants. It is probable that Fastai’s Tabular mode, the model used in the current research, does not function well with small datasets. Thus, it is suggested that future work utilize neural networks and decision trees better equip to predict integers given smaller datasets.
Finally, future iterations of this current research should also seek to compare results found with new synthetic datasets to those created with real-life data as well as investigating the accuracy of a variety of neural network models.
Bibliography
Craig A. Johnson (2012) Governing climate displacement: the ethics and politics of human resettlement, Environmental Politics, 21:2, 308-328, DOI: 10.1080/09644016.2012.651905
“Environmental Migration.” Migration Data Portal, https://www.migrationdataportal.org/themes/environmental_migration_and_statistics.
Ginnetti, Justin, and Travis Franck. “Horn of Africa Technical Report - IDMC.” Norwegian Refugee Council (NRC), Internal Displacement Monitoring Centre (IDMC), https://www.internal-displacement.org/sites/default/files/publications/documents/201405-horn-of-africa-technical-report-en.pdf
Lustgarten, Abrahm. “The Great Climate Migration.” The New York Times, The New York Times, 23 July 2020, https://www.nytimes.com/interactive/2020/07/23/magazine/climate-migration.html. Martin, S. (2010). Climate Change, Migration, and Governance. Global Governance , 16(3), 397-414.
Robinson C., Dilkina B., Moreno-Cruz J. Modeling migration patterns in the USA under sea level rise. PLoS ONE. 2020;15(1) doi: 10.1371/journal.pone.0227436
Walter Kälin, ‘Conceptualising Climate-Induced Displacement’ in Jane McAdam (ed.), Climate Change and Displacement: Multidisciplinary Perspectives (Oxford: Hart Publishing, 2010) pp. 81-103.
Group: Ben Luo & Neely Yates